

本文为大家带来的是剑桥雅思真题范文分析系列八,希望考生能够多多参考,以便更好的备考雅思考试。想要拿到雅思高分就需要考生坚持到最后,不轻言放弃。
雅思作文题目:
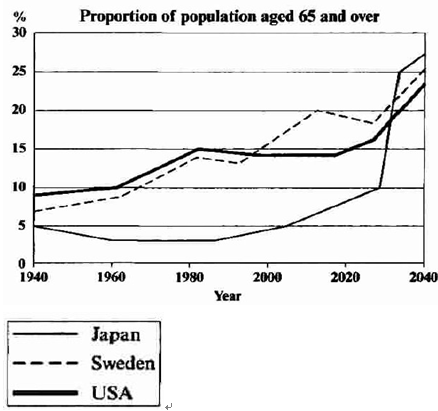
The graph below shows the proportion of the population aged 65 and over between 1940 and 2040 in three different countries.
Summarize the information by selecting and reporting the main features, and make comparisons where relevant.(剑5 test1 task1)
范文:
The graph shows the increase in the ageing population in Japan, Sweden and the USA. It indicates that the percentage of elderly people in all three countries is expected to increase to almost 25% of the respective populations by the year 2040.
In 1940 the proportion of people aged 65 or more stood at only 5% in Japan, approximately 7% in Sweden and 9% in the US. However, while the figures for the Western countries grew to about 15% in around 1990, the figure for Japan dipped to only 2.5% for much of this period, before rising to almost 5% again at the present time.
In spite of some fluctuation in the expected percentages, the proportion of older people will probably continue to increase in the next two decades in the three countries. A more dramatic rise is predicted between 2030 and 2040 in Japan, by which time it is thought that the proportion of elderly people will be similar in the three countries.
一、题目类型:
折线图-1个图
二、题目简要内容:
在1940至2040年间三个不同国家65岁及以上人口的比例-日本、瑞典、美国
三、关注点:
老年人口比例及趋势
四、素材积累:
人口比例变化的描述会涉及到一些变化的词汇,比如上升,下降,波动等,还有修饰性的副词。
趋势:Trend, tendency, momentum;
上升: increase, rise, soar, accelerate, ascend, rocket;
下降: decelerate, decline, decrease,descend, diminish, dip
波动: fluctuate, rebound, wave, rise and fall,
变化程度:
dramatic-dramatically-戏剧性的,急剧的/地
Sudden-suddenly-突然的/地
Sharp-sharply, 明显的,急剧地
五、论据积累:
小作文曲线图的写作要根据图中所示信息,来具体阐述。我们可以按照横坐标来排列,把1940-2040分成几个部分来写。不仅要涉及曲线各自的变化,还要涉及各个曲线之间的对比。时态的运用也需要多注意。
六、结构分析:
对于曲线图而言,我们要分析每条曲线各自的变化以及彼此之间的共同点和差异点。
第一段:
首先简述了曲线图的内容,然后指出这三条曲线的共同恃点:2040年,老年人占各自国家人口的百分比达到25%:The graph shows the increase in the ageing population in Japan, Sweden and the USA. It indicates that the percentage of elderly people in all three countries is expected to increase to almost 25% of the respective populations by the year 2040.
be expected to有望做某事;被期待做某事
respective adj. 分别的,各自的
第二段:
先描述曲线的起点,即1940年三个国家的老年人百分比:In 1940 the proportion of people aged 65 or more stood at only 5% in Japan, approximately 7% in Sweden and 9% in the US.
然后指出1940至2000 年期间瑞典和美国的共同趋势以及日本的特殊变化:However, while the figures for the Western countries grew to about 15% in around 1990, the figure for Japan dipped to only 2.5% for much of this period, before rising to almost 5% again at the present time.
stand at达到
dip to 下降,下沉
第三段:
描写三个国家老年人口在2000至2040年期间的预计比例变化情况:In spite of some fluctuation in the expected percentages, the proportion of older people will probably continue to increase in the next two decades in the three countries.
重点之处是日本的特殊变化:A more dramatic rise is predicted between 2030 and 2040 in Japan, by which time it is thought that the proportion of elderly people will be similar in the three countries.
以上就是剑桥雅思真题范文分析系列八的详细内容,希望广大考生如愿考出自己理想的雅思成绩! 更多内容请持续关注前程百利雅思频道或者拨打服务热线400-890-6000。
您还可能关注:


