

本文为大家带来的是剑桥雅思真题范文分析系列九,希望考生能够多多参考,以便更好的备考雅思考试。想要拿到雅思高分就需要考生坚持到最后,不轻言放弃。
雅思作文题目:
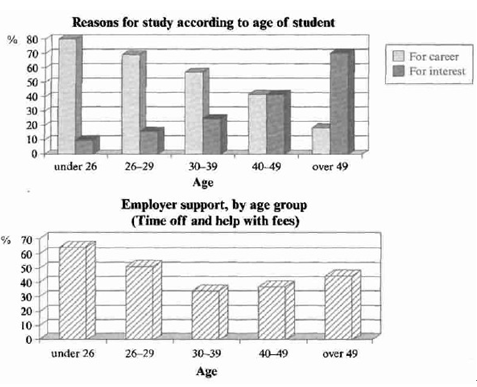
The charts below show the main reasons for study among students of different age groups and the amount of support they received from employers.
Summarize the information by selecting and reporting the main features, and make comparisons where relevant.(剑5 test2 task1)
范文:
The bar charts indicate the reasons for study among different age groups and employer support to them.
The first chart shows nearly 80% of students under 26 study for their career. This percentage gradually declines with the increase in age. Conversely, study stemming from interest increases with age. There are only 10% of students under 26 studying out of interest. The percentage grows steadily to 40% among those in their 40s, almost the same as those studying for career. Among students over 49, 70% of them study for interest in comparison to 18% for career reasons in that age group.
The second chart shows that employer support is maximum (approximately 60%) for students under 26. The percentage drops rapidly to 32% for students between 30 and 39, and then increases in late adulthood up to about 44%. It is unclear whether employer supports is only for career-focused Study, but the highest level is for those students who mainly study for career purposes. The bar charts indicate the reasons for study among different age groups and employer support to them.
一、题目类型:
柱状图-2个
二、题目简要内容:
1-不同年龄段的学生学习的主要原因;2-不同年龄段人收到雇主支持的比例
三、关注点:
学习
四、素材积累:
数据分析时所需表达方式,我们要多多积累。
The bar chart illustrates/shows/reflects/demonstrates/ represents that…
As is shown in the bar chart that…
Displayed in the bar chart is/are….
It can be concluded from the bar chart that…
The bar chart presents the general trend in…
This bar chart displays the numbers of…
The number of … increased by %…
The number of… dropped by %…
五、论据积累:
描写过程中需要有一些重点数据的支持,要合理分析图表中数据。
六、结构分析:
分析
本题由两个柱状图组成。可以分成三段进行阐述,首段介绍一下图表的基本信息,然后分别分析这两个柱状图的主要趋势和特点。
首段:
首段介绍图表的基本信息:The bar charts indicate the reasons for study among different age groups and employer support to them.
第二段:
图一主要需要分析出为职业发展而学习的学生的百分比随着年龄的增长而减少,而为了兴趣爱好而学习的学生的百分比随着年龄的增长而增长:
The first chart shows nearly 80% of students under 26 study for their career. This percentage gradually declines with the increase in age. Conversely, study stemming from interest increases with age. There are only 10% of students under 26 studying out of interest. The percentage grows steadily to 40% among those in their 40s, almost the same as those studying for career. Among students over 49, 70% of them study for interest in comparison to 18% for career reasons in that age group.
stem from起源于,来自
out of interest没有兴趣
in comparison to与…相比
第三段:
图二主要指出26岁以下一直到30多岁的学生群体获得雇主的资助的百分比逐渐下降,但之后又随着年龄的增长而增长:
The second chart shows that employer support is maximum (approximately 60%) for students under 26. The percentage drops rapidly to 32% for students between 30 and 39, and then increases in late adulthood up to about 44%. It is unclear whether employer support is only for career-focused study, but the highest level is for those students who mainly study for career purposes.
adulthood 成年,成人期
以上就是剑桥雅思真题范文分析系列九的详细内容,希望广大考生如愿考出自己理想的雅思成绩! 更多内容请持续关注前程百利雅思频道或者拨打服务热线400-890-6000。
您还可能关注:


