

曲线图是雅思小作文考试中常常出现的一种提醒,如果曲线较少还比较好写,如果曲线较多,考生就要仔细分析图中曲线的变化情况并进行对比分析。今天,前程百利小编为大家分享的是雅思曲线图之英国不同交通方式货物运输数量对比变化,可供考生参考学习。
雅思作文题目:
You should spend about 20 minutes on this task.
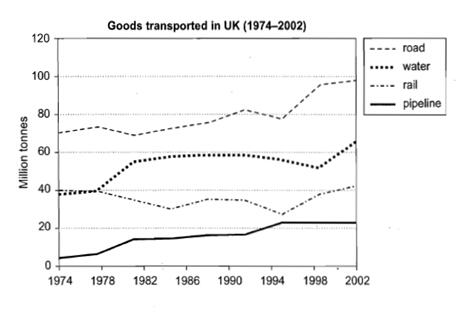
The graph below shows the quantities of goods transported in the UK between 1974 and 2002 by four different modes of transport.
Summarise the information by selecting and reporting the main features, and make comparisons where relevant.
Write at least 150 words.(剑8 test4 task1 )
范文:
The graph illustrates the quantities of goods transported in the United Kingdom by four different modes of transport between the time period of 1974 and 2002. Over this span of 28 years, the quantities of goods transported by road, water and pipeline have all increased while the quantities transported by rail has remained almost constant at about 40 million tonnes.
The largest quantities of goods transported both in 1997 and 2002 was by road(70 million tonnes and 98 million tonnes respectively) while the lowest both in 1974 and 2002 was by pipeline(about 5 million tonnes and 22 million tonnes respectively). The amount of goods transported by water was constant from 1974 to 1978, where it showed an exponential growth, rising to around 60 million tones after which it plateaued for about 20 years before starting to rise gradually again.
The amount of goods transported by rail is almost constant at 40 million tonnes in 1974 and 2002, with decreases in quantity in between the years. It is also interesting to note that almost all showed a decrease in 1994 in amount of goods transported except for the pipeline, which actually peaked in that year.
In conclusion,the road remains the most popular method of transporting goods in the UK. While water and pipelines are becoming increasingly used, rail have not become more popular was a method of transport.
一、题目类型:
折线图-1个图-4线
二、题目简要内容:
英国货物运输的数量-不同的交通方式
三、素材积累:
increase, show growth, rise 增加
quantity /amount of goods 货物数量
decrease, show decrease 减少
remain constant 保持不变
modes /method of transport 交通方式
illustrate v.说明
exponential adj.指数的,呈几何级数的
span n.跨度,一段时间
plateau v.达到稳定水平
It is also interesting to note that….
四、论据积累:
雅思小作文的写作不像是大作文,要提供论据来支撑,小作文中曲线图的描写就是要根据图中的具体数字来阐释曲线之间的比较与变化。
五、结构分析:
曲线图的写作思路常常为先根据横坐标来分析每条曲线各自的变化, 然后再把不同的曲线进行比较。如果曲线较多,考生就要进行分类,可以把增长的归为一类,减少的归为一类。
段落分析:
第一段:
第一句改写题目,不过没有改动很多:
The graph illustrates the quantities of goods transported in the United Kingdom by four different modes of transport between the time period of 1974 and 2002.
第二句总结了四种交通方式变化趋势的主要区别,其他三种方式运输货物数量有所增加,只有铁路运输货物数量基本不变:
Over this span of 28 years, the quantities of goods transported by road, water and pipeline have all increased while the quantities transported by rail has remained almost constant at about 40 million tonnes.
span 跨度,范围
第二段:
第二段总的来说是对不同曲线进行描写和比较,从中我们也可以看不到每条曲线的变化情况,也就是先指出四种运输方式中两种最极端的--运输量最大的公路和最小的管道,并分别给出起始年份和终止年份所对应的数量,用具体数字来充分说明:
The largest quantities of goods transported both in 1997 and 2002 was by road(70 million tonnes and 98 million tonnes respectively) while the lowest both in 1974 and 2002 was by pipeline(about 5 million tonnes and 22 million tonnes respectively).
然后,描述剩下的两种运输方式里水路的运输情况:
The amount of goods transported by water was constant from 1974 to 1978, where it showed an exponential growth, rising to around 60 million tones after which it plateaued for about 20 years before starting to rise gradually again.
plateau vi. 达到平衡;达到稳定时期
exponential adj. 指数的
where 应改为when,用来修饰1978
第三段:
第三段描述的是铁路运输情况:
The amount of goods transported by rail is almost constant at 40 million tonnes in 1974 and 2002, with decreases in quantity in between the years.
除了指出起始时间与终止时间的数量之外,还指出了情况有所不同的1994年的四种运输方式的情况:
It is also interesting to note that almost all showed a decrease in 1994 in amount of goods transported except for the pipeline, which actually peaked in that year.
几乎所有交通方式运输的货物量在1994年都有所下降,只有管道除外,事实上管道运输货物量在该年达到最高峰。
结尾段:
结尾段总结了四种运输方式的发展变化趋势:公路运输最流行,水路和管道运输逐渐增加,而铁路运输基本保持不变。
In conclusion,the road remains the most popular method of transporting goods in the UK. While water and pipelines are becoming increasingly used, rail have not become more popular was a method of transport.
参考译文:
该曲线图描述了1974年至2002年期间英国通过四种交通方式运输的货物数量。在这28年期间不变,通过公路、水路和管道运输的货物数量都增加了,而铁路运输的货物数量几乎一直保持在4000万吨左右不变。
1974年和2002年最大宗的货物运输都是通过公路(分别为7000万吨和9800万吨)来完成的,而1974年与2002年运输货物数量最少的交通方式都是管道(分别为大约500万吨和2200万吨)。水路运输的货物数量在1974年至1978年之间没有变化,接下来呈指数形式增长至将近6000万吨,之后这个数字保持了大约20年不变,然后又开始逐渐增加。
钦路运输的货物数量在1974年和2002年几乎没有变化,为4000万吨,在此期间的数量有所下跌。值得注意的是,几乎所有交通方式运输的货物量在1994年都有所下降,只有管道除外,事实上管道运输货物量在该年达到最高峰。
总之,在英国,公路一直是最流行的货物运输方式;水路和管道的使用日益增加,而铁路作为运输方式并不很受欢迎。
以上就是雅思曲线图之英国不同交通方式货物运输数量对比变化的详细内容,考生不仅要不断积累好的素材,好的写作思路,还要勤加练习才会知道自己的不足并改进,一定会取得满意的雅思成绩。更多雅思备考经验我们将会陆续为大家更新,前程百利雅思考试频道不可错过!欢迎咨询我们的热线电话400-890-6000。
您还可能关注:


