

2016年5月将会迎来大陆考生的第一次SAT考试,备战新SAT考试的考生们都在努力备考中。新设计的SAT考试更加人性化,更加注重实用性,俗话说更加接地气,下面要给大家介绍的是语法中的新增题型,新SAT语法中数据解释题。
一.新SAT语法数据解释题
为了考察学生的知识实际运用能力和对应用型图表的数据理解能力,College Board在语法部分新增了数据解释题。College Board对于这种题型增加的解释原因是“ You’ll need to combine a solid understanding of the text with an accurate interpretation of the data displayed in the graph.”即考生需要将对于图表数据的正确诠释融合进文本的理解当中。因为在阅读部分也出现了考察图表的题目,那么语法中数据解释题和阅读部分图表的不同的是, 语法注重以一种更直接方式整合数据和图表信息。
二.新SAT语法数据解释题所占比重
新SAT语法数据解释题题目在每套题中出现频率为一个,题量小,难度也比较低。学生们知晓这种题型的存在即可,了解这种题型的出题模式,答题方法,考察重点即可,我们发现语法部分侧重数据与句子内容的紧密契合以及利用文字将图表信息转换为文字信息。而相对于数学部分的数据表格类题目是对信息的处理与实际应用。
三.新SAT语法数据解释题应对方法
新SAT语法数据解释题在语法中的考试比例虽然不大,但是也是大家要认真对待的,不可丢人。首先要阅读题目结合图标,看清楚图标横纵坐标,找到题目中的关键信息和数据,那么在结合问题中的未知问题,进行查找。根据样题来看,这里题目的难度不大,理清题目很容易找出答案。
四.新SAT语法官方样题解析
[. . .] Transportation planners perform critical work within the broader field of urban and regional planning. As of 2010, there were approximately 40,300 urban and regional planners employed in the United States. The United States Bureau of Labor Statistics forecasts steady job growth in this field, projecting that 16 percent of new jobs in all occupations will be related to urban and regional planning. Population growth and concerns about environmental sustainability are expected to spur the need for transportation planning professionals.
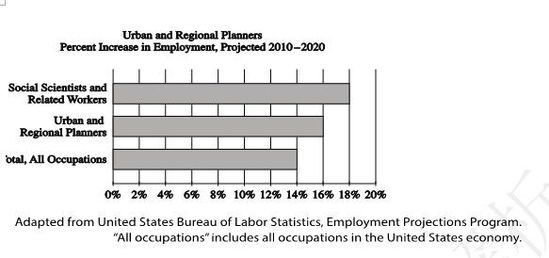
Which choice completes the sentence with accurate data based on the above graph?
A) NO CHANGE
B) warning, however, that job growth in urban and regional planning will slow to 14 percent by 2020.
C) predicting that employment of urban and regional planners will increase 16 percent between 2010 and 2020.
D) indicating that 14 to 18percent of urban and regional planning positions will remain unfilled.
题目:哪一个选项中的句子可以准确的概括表格中的数据?
答案:C
解析:本题是全新的题型,图表分析题,本题不仅考查考生的语法能力,还考查考生的理科分析能力,根据图表分析数据。首先我们看到横坐标是所占比例,纵坐标是职业,那么图中关键词是urban and regional planning,确定比例是16%,那么这个表格是2010-2020的时间,所以应该是即将发生的,所以C符合。
以上就是关于新SAT圆中数据解释题的讲解,希望考生对于这类新题型能够有更清楚的认识,预祝大家的SAT考试一切顺利。
您还可能关注:


