

今天我们来认识几种图表解读题的新形势,相信通过老师的讲解大家能够更快地认识这种题型该如何解答。
一、图表分析题的含义
图表解读题的提干中必然会出现一个图表,但是图表的形式是不限的,各种各样的图表都有可能出现,下面我们就来看其中几个题型。
二、图表分析题的例题分析
1、例题一——散点图。
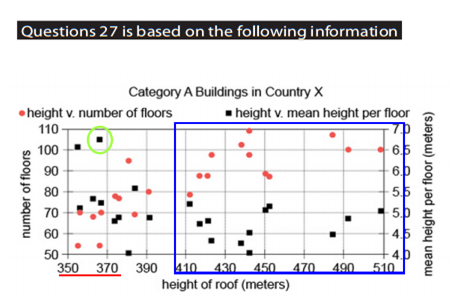
In Country X, a building is in Category A if it has a roof height of at least 350 meters. In the graph, each of the 22 Category A buildings is represented by two points arranged vertically: one representing the comparison of the height of the building's roof to the number of floors (red circles), the other representing the comparison of the height of the building's roof to the mean height per floor (black squares).
Based on the given information, use the drop-down menus to most accurately complete the following statements about Category A buildings in Country X.
A .The building with the greatest mean height per floor has a roof height between……meters.
选项:350-370 430-450 470-490 490-510
B. There is a ……correlation between the number of floors and the mean height per floor.
选项: strong positive negligible strong negative
分析:通过分析图表我们发现,红点代表的是number of floors(可能代表楼层数量和楼层高度的关系),黑点代表的是楼层每一层的平均高度。虽然这个图表是在一个坐标系中,但是图表左右两边却各有一个纵坐标,左边的纵坐标是楼层数量,右遍的纵坐标是楼层平均高度,横坐标是代表楼层的高度。这样我们就对图有了一个初步的认识。
题意:根据已经给出的信息,我们能推出下面哪一个选项是正确的?
问题一:最大的平均高度下,这栋楼的高度是多少?
分析:平均高度是图表右边的纵坐标,并且图中黑色的点代表平均高度,问最大平均高度,应该是最上面的黑色点(如上图被黄色框圈住的点),对应的横坐标的楼层的高度是350-370。正确答案为350-370。
问题二:在两个纵坐标之间有一个关系,the number of floors和the mean height per floor之间是什么关系?
分析:图片中,左侧开始红色点在上方,右侧红色点处在黑色点的下方,呈下降趋势;而黑色的点正好相反,左侧开始黑色点在下方,右侧黑色点处在黑色点的上方,呈上升趋势。所以,两种点代表的意思是反比例关系。正确答案是strong negative。
2、例题二——折线图。
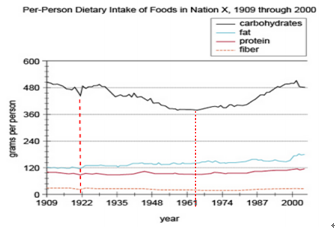
The graph depicts the per-person dietary intake of foods in 4 categories for the people of Nation X for the years 1909 through 2000. A decline in consumption in all 4 categories strongly suggests an overall food shortage rather than a simple change in dietary pattern.
From each drop-down menu, select the option that creates the most accurate statement about food consumption in Nation X based on the information provided.
A. The graph suggests that Nation X most likely experienced a food shortage shortly before the year……
选项: 1922 1961 2000
B. For the year that the total dietary intake of carbohydrates was lowest, the per-person intake of carbohydrates was approximately……times the per-person intake of dietary fiber.
选项: 3 9 18 27
题意:先看四条线分别代表饮食摄入量,纵坐标是单个人的克数,横坐标是时间1909年——2000年的连线。当四条线都下降时它代表的是食物的短缺,并不仅仅是饮食习惯的改变。(这个条件很关键)
问题一:这个图表当中,在那个时间体现了食物短缺?
分析:我们在提干中得知当四条线都下降时它代表的是食物的短缺,在1922年四条直线都有下降趋势,所以判断正确答案为1922年。
问题二:在carbohydrates摄入量最低时,它是fiber摄入量的多少倍?
分析:我们找到蓝线的最低点(即carbohydrates摄入量最低时)大约是380g,对应的紫色的摄入量是(fiber摄入量)20g,所以大约是19倍。正确答案为19。
3、例题三——柱状图。
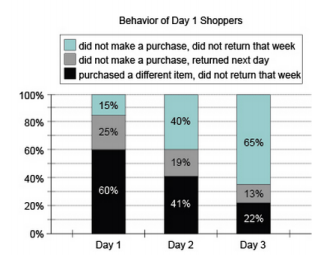
On Days 1 through 4 of a recent week, Product X was out of stock at Retailer R Day 1 shoppers are those shoppers who came to Retailer R on Day 1 of that week seeking Product X For each of the first 3 days of that week, the graph shows the subsequent behavior of all the Day 1 shoppers who came to Retailer R seeking Product X on that day. Shoppers at Retailer who purchased more for the item a different item in lieu of Product X paid an average of 30%. From each drop-down, select the option that creates the most accurate statement based on the information provided.
A. ……IP1% of Day 1 shoppers returned to the store on Day 3.
选项:Fewer than 1 Between 1 and 10 More than 10
B. Shoppers at Retailer R who purchased substitute items from other manufacturers on Day 1 ……. % of the total all paid a total amount that was approximately Day 1 shoppers would have paid had each of them been able to purchase Product X on Day 1.
选项: 60 78 100 130
问题一:选出在第一天当中,百分之多少的消费者在第三天又回到了商店。意思是在第一天和第二天都没有买到X商品。
分析:第三天返回,那么就是找灰色的,也就是同时满足第一二天灰色条件, 即25%*19%=4.75%。属于选项中,between 1 and 10.
问题二:如果购买者在第一天买的是其它商家的产品,而没有买X的产品, 第一天顾客买其它产品花费的费用,是顾客本来能够购买的X产品的百分之多少?
说的是:提干中在R中买替代产品X的产品(就是买了别的产品)需要多付平均30%的钱,即一共付130%的费用。没人买产品X,但是有60%的人来买替代产品 所以 130%*60%=1.3*0.6=0.78=78%。
习题练习:
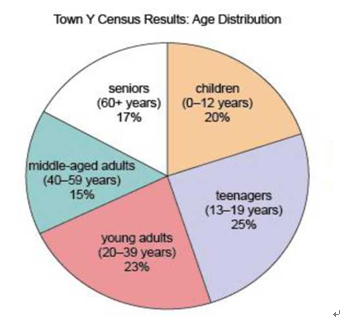
A recent census revealed the age distribution of the residents of Town Y, shown in the graph, Since the census was performed, no resident has moved into or away from Town Y and there have been no recorded births or deaths.
Based on the given information, use the drop-down menus to most accurately complete the following statements.
A. The census indicates that teenagers ……times as many residents were children or as were seniors.
选项:children:20% teenagers:25% seniors:17%
答案:题目问的是,(把总体看做100) (20+25) 121=2.65。
B. If at the time of the census ,there were 540 more people aged 0-39 than people aged 40 or greater, then the population of Town Y at the time of the census was……
答案:设town Y有Y人。0-39:占(20+25+23) %=68% 40以上占(15+17) %=32%
列出式子:(68%-32%) Y=540 36%Y=540 Y=1500。
拓展阅读:
1、图表解读题的概念。
图表解读题Graphics Interpretation:要求申请人对图形或图像进行说明,并通过选择相应选项来回答相关陈述是否正确。
2、图表解读题的表现形式。
1)多元推理题的标签页下给出两至三个信息来源后会提出问题。信息源可能是一篇短文。其它信息来源可能是表、图、或其他类型的视觉信息。屏幕上每次仅会展示唯一的一个信息源。我们可以通过选择不同的选项卡来查看不同的来源。
2)每个问题都会出现在屏幕的右侧,所以和问题对应的信息源会轮流出现在屏幕的左侧。
3、图表解读题的提问方式。
1)依据原文,是否每一个陈述都是对的?
2)是否每个语句或数值的来源都是一致的?
3)是否每个语句或代数表达式都能解决原文中提到的问题?
4)是否每一个代数表达式的值都来源于原文?
4、图表解读题的考察目的。
不同的信息源会伴随着不同的问题,这些问题可能会考察你比较、解释或应用信息的能力。
5、图表解读题的解题策略。
1)不必完全熟知多元题所提供的材料中的所有信息。
2)仔细分析每一个信息来源,因为回答问题需要详细了解原文所提供的信息。
3)仔细阅读问题,确保自己明白原文问的是什么。
4)选择答案要选择原文中最有力地证据。
您还可能关注:


